 virtualhome.blog My blog about virtualized infrastructures, backup and disaster recovery topics and the cloud !
Related Articles


This final part of the series now covers on how to set up the universal forwader on the Veeam server and how to establish a connection to our Splunk server. The Veeam technology addon for Splunk will be covered in this article aswell, as it is responsible for pushing data to our Splunk server. In the end we will be able to monitor our Windows Veeam Backup & Replication Server as well as the data which the technology addon pushes to the Splunk server.
Configuring Splunk Receiver
First of all we need to enable our Splunk Receiver. Since we already have configured our firewalls to use TCP port 9997, we only have to enable respectively add our receiver.
This can be achieved either with the webinterface or the CLI. Since the configuration is fairly easy with the webinterface, i will cover this way here. How to enable receivers is also listed in the documentation of Splunk.
https://docs.splunk.com/Documentation/Splunk/7.3.0/Forwarding/Enableareceiver
For adding a receiver, log in to your webinterface and navigate to Settings -> Data -> Forwarding and Receiving -> Add new
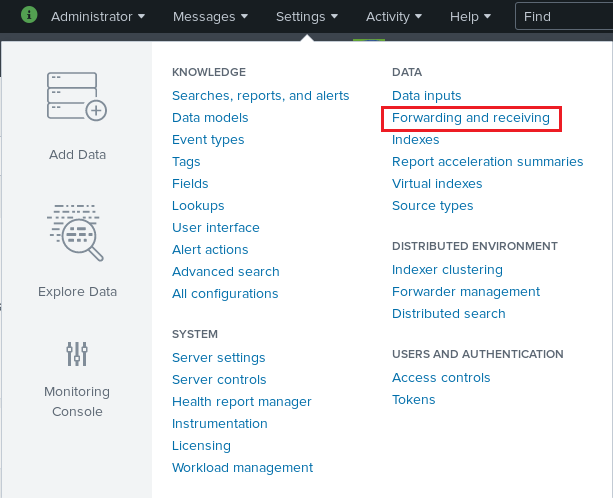
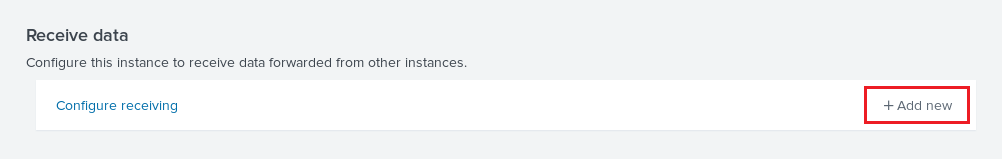
After clicking on “Forwarding and receiving”, add a new receiver with the right hand button “+Add new”
Enter the desired port on which the receiver should listen to and click the save button. In our case it is the TCP port 9997.
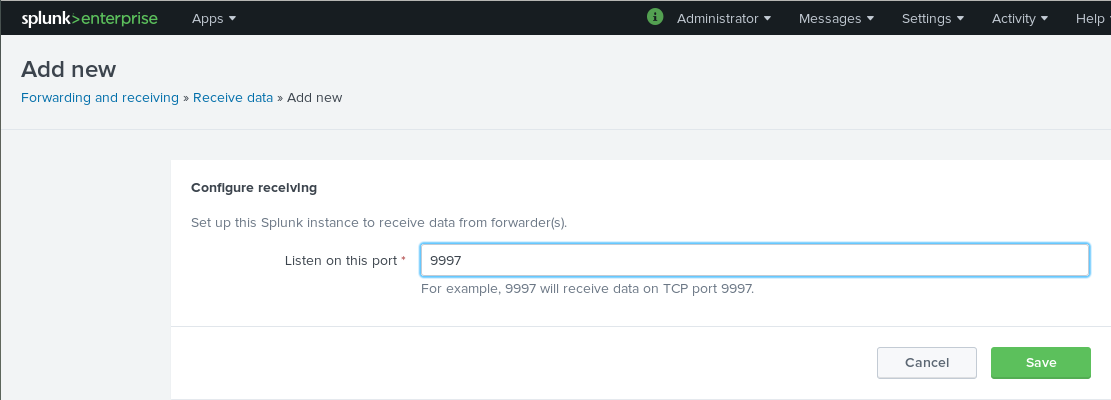
Now that our Splunk server is listening and receiving data from this TCP port we can head to our Veeam Backup & Replication server and install the universal forwarder.
Installing the universal forwarder on the Veeam server
The universal proxy is also downloadble from the splunk website.
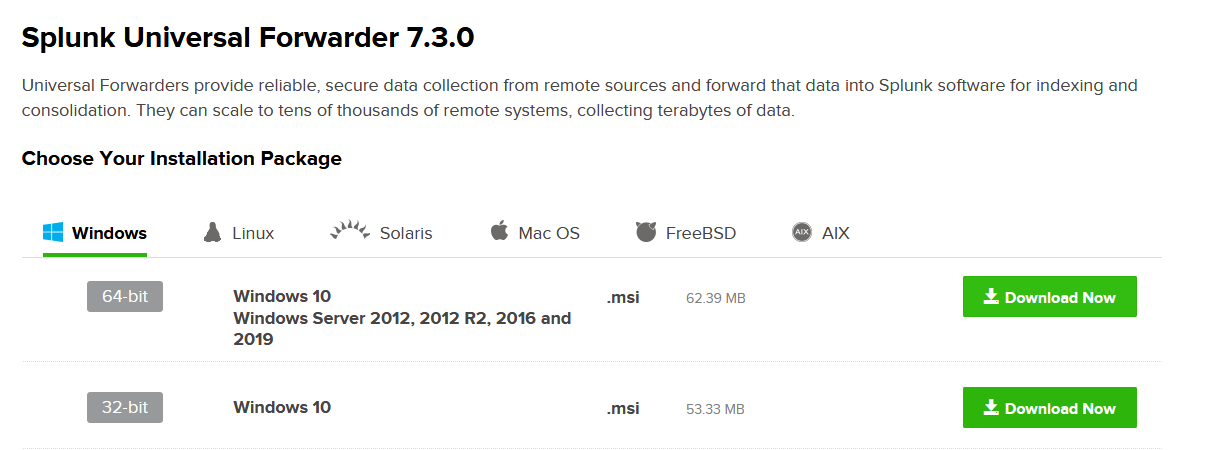
After downloading the universal forwarder, start the installation as an administrator on your Veeam Backup & Replication server.
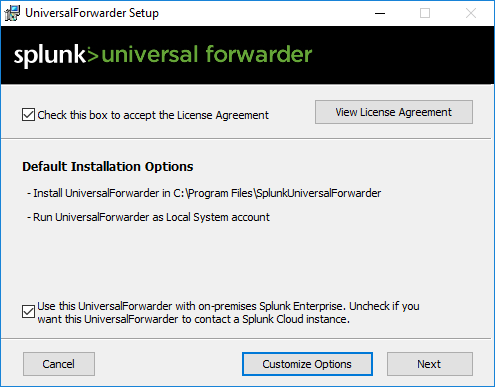
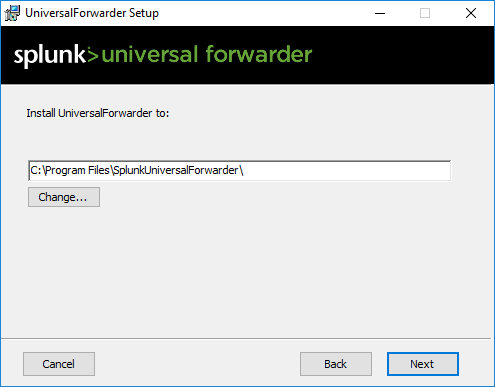
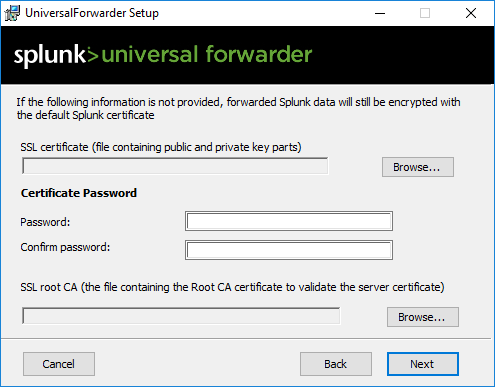

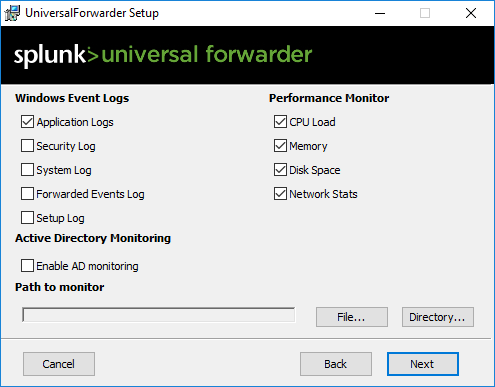
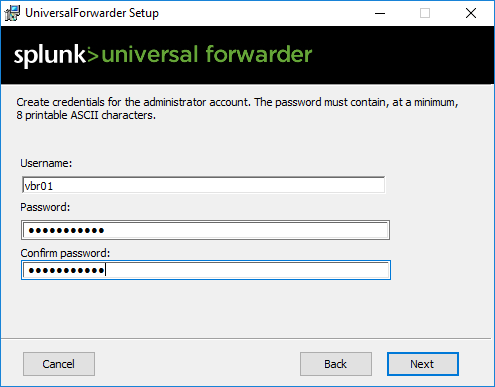
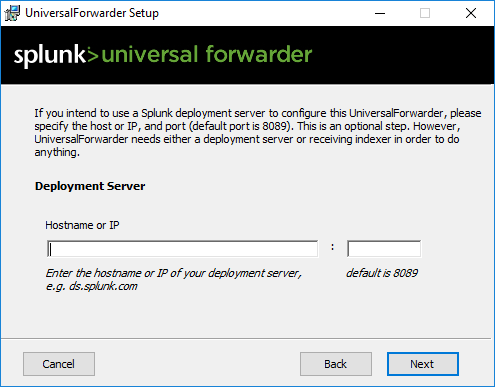
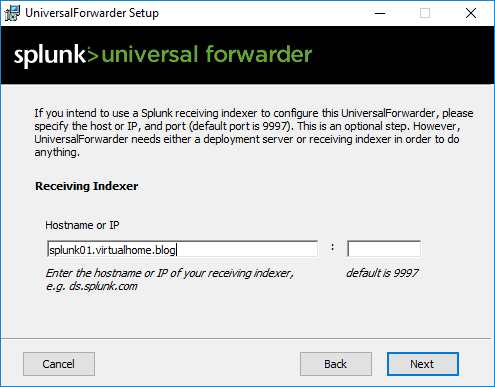

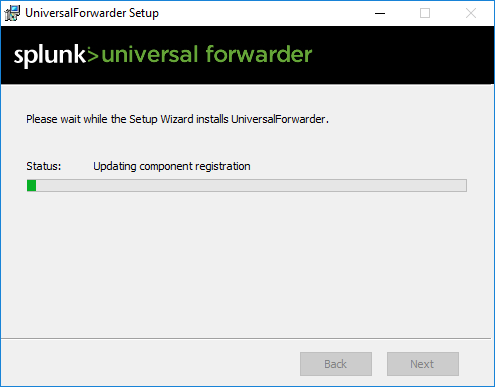
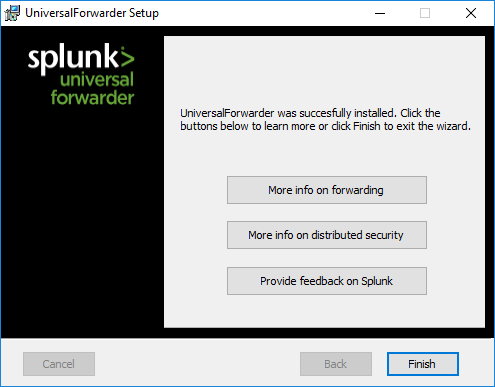
I documented the installation of the universal forwarder in the above gallery. Make sure to choose which “general” Windows logs you want to push. Also make sure to add your Splunk Server in Step 8, meaning connecting to your receiver.
If everything went successful, you should be able to see Windows Event Logs in your Splunk webinterface. Let’s try that out !
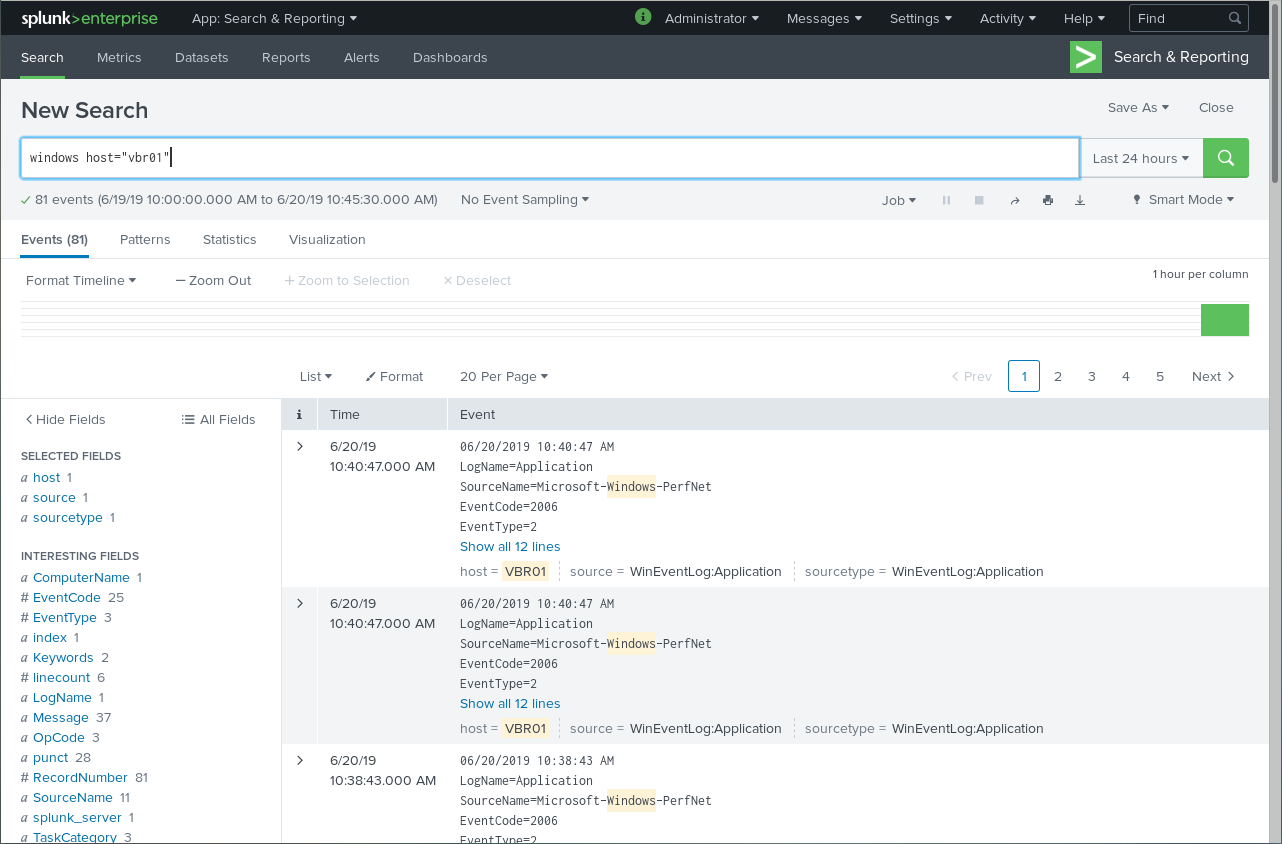
Head to “Search and Reporting” and search for your windows host which is your Veeam Backup & Replication server.
With “windows host =”HOSTNAME”” you are able to search for your server and its logs, which functions correctly here ! That means, that the data collection respectively the connection from the Veeam server over TCP 9997 to our Splunk server is working as desired.
Now that our Veeam Backup & Replication Server is properly communicating with our Splunk server we are able to install the technology addon on our Veeeam Backup & Replication server.
Installing the Veeam Technology Addon for Splunk on the Veeam server
As you remember, we downloaded the “Veeam Backup Monitor for Splunk” which also consists of the TA (Technology Addon) which has to be placed on the Veeam Backup & Replication server.
Now grab your downloaded and extracted plugin folder and place it on your Veeam Backup & Replication server.I placed it on “C:\SPLUNK”
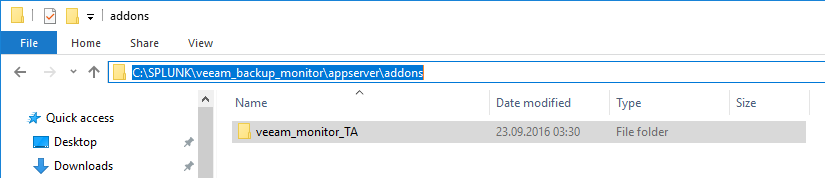
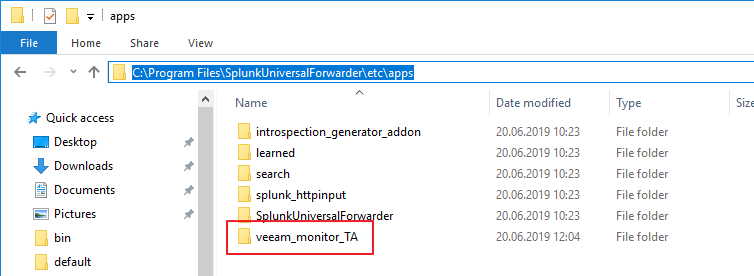
Navigate trough your placed folder and go to “veeam_backup_monitor\appserver\addons”. Here you will find the folder “veeam_monitor_TA”.
Copy this folder to the “apps” folder of your installation path of the universal forwarder. In my case it is “C:\Program Files\SplunkUniversalFolder\etc\apps”
To enable the plugin, navigate into the “veeam_monitor_TA” folder to the “bin” directory.
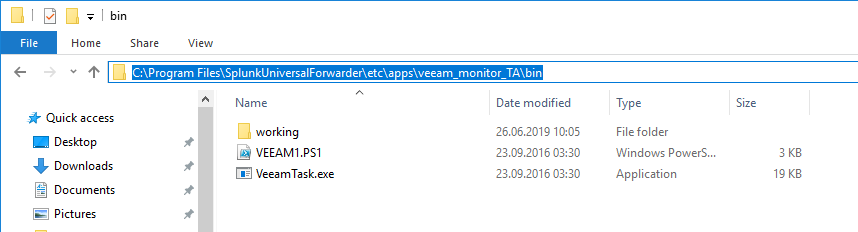
In this directory you will find the core components of the technology addon.
- A PowerShell Script for collecting Veeam Data through the Veeam PowerShell Snap-In
- A VeeamTask.exe which sets up the PowerShell Script and a scheduled Task for collecting Veeam Data
- A “working” folder where the outputs of the PowerShell Script are beeing placed
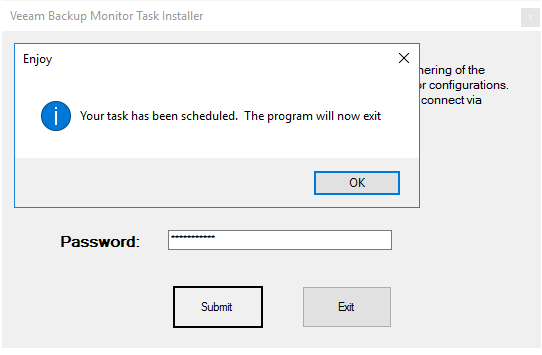
To setup the technology addon we first have to start the “VeeamTask.exe”.
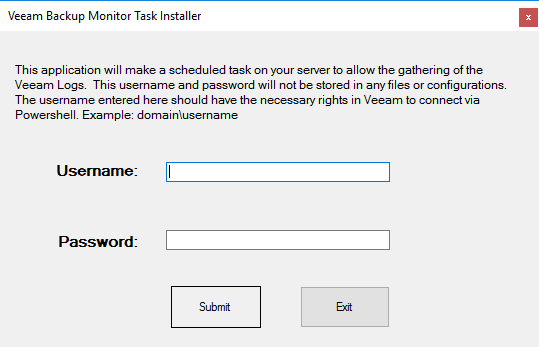
After starting the “VeeamTask.exe” you will need to provide a username and password which should have the necessary right to connect to the PowerShell. As I’m using a lab machine I chose the local administrator for this.
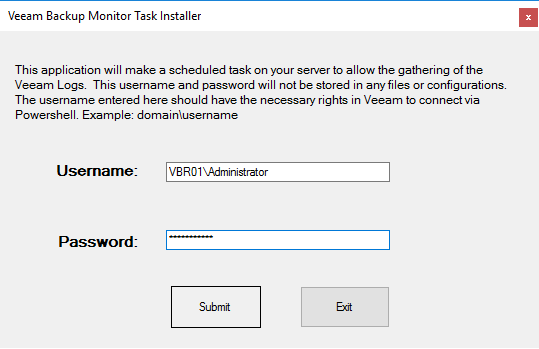
By clicking the “Submit” Button, the “VeeamTask.exe” checks for necessary rights and creates a scheduled task which triggers the PowerShell Script to push data to the Splunk server.
If you open up the Task Scheduler, you will see a new Schedules Task which triggers the enclosed PowerShell script.

The PowerShell script which gets triggered looks like this:
#Created by Joseph Noga of Komodo Cloud for use with Veeam Backup Monitor
#Tested on Veeam 9 and SPlunk 6.3.4

Add-PSSnapin VeeamPSSnapin
$ScriptPath = Split-Path -Parent -Path $MyInvocation.MyCommand.Definition
$date1 = Get-Date -Date "01/01/1970"
$date2 = Get-Date

$Epoch = (New-TimeSpan -Start $date1 -End $date2).TotalSeconds
Get-VBRViProxy -Name * | Select @{N="#Date";E={$date2}}, @{N="Name";E={$_.Name}}, @{N="Host";E={$_.Host}}, @{N="Type";E={$_.Type}}, @{N="IsDisabled";E={$_.IsDisabled}},@{N="Description";E={$_.Description}}  | Export-csv -Path $ScriptPath\working\"BKPPXY"$Epoch.csv -NoTypeInformation
Get-VBRBackupRepository | Select @{N="#Date";E={((Get-Date))}},@{N="Name";E={$_.Name}},@{N="Path";E={$_.Path}}, @{N="FreeSpace";E={[math]::Round(($_.Info.CachedFreeSpace | Measure-Object -Sum).Sum/1GB,1)}},@{N="TotalSpace";E={[math]::Round(($_.Info.CachedTotalSpace | Measure-Object -Sum).Sum/1GB,1)}}, @{N="Id";E={$_.Id}} |Export-csv -Path $ScriptPath\working\"VBREPO"$Epoch.csv -NoTypeInformation
Get-VBRServer -Name * | Select @{N="#Date";E={$date2}}, @{N="Name";E={$_.Name}}, @{N="Info";E={$_.Info}}, @{N="Type";E={$_.Type}}, @{N="ApiVersion";E={$_.Apiversion}} | Export-csv -Path $ScriptPath\working\"BKPSVR"$Epoch.csv -NoTypeInformation
Get-VBRJob -Name * | Select @{N="#Date";E={$_.FindLastSession().Progress.StartTime}}, @{N="Session";E={$_.FindLastSession().Name}},@{N="TransferedGB";E={[math]::Round(($_.FindLastSession().Info.Progress.TransferedSize | Measure-Object -Sum).Sum/1GB,1)}},@{N="Duration";E={$_.FindLastSession().Progress.Duration}},@{N="id";E={$_.FindLastSession().Id}},@{N="TotalSize";E={[math]::Round(($_.FindLastSession().Progress.TotalSize | Measure-Object -Sum).Sum/1GB,1)}},@{N="TotalUsedSize";E={[math]::Round(($_.FindLastSession().Progress.TotalUsedSize | Measure-Object -Sum).Sum/1GB,1)}},@{N="AvgSpeed";E={[math]::Round(($_.FindLastSession().Progress.AvgSpeed | Measure-Object -Sum).Sum/1MB,1)}},@{N="Result";E={$_.FindLastSession().Result}},@{N="GetType";E={$_.Info.JobType}},@{N="EndTime";E={$_.FindLastSession().Progress.StopTime}} | Export-csv -Path $ScriptPath\working\"JOBDET"$Epoch.csv -NoTypeInformation
Get-VBRBackup -Name * | Select @{N="#Date";E={$_.LastPointCreationTime}}, @{N="Job_Name";E={$_.Name}}, @{N="Size";E={[math]::Round(($_.GetAllStorages().Stats.BackupSize | Measure-Object -Sum).Sum/1GB,1)}},@{N="DataSize";E={[math]::Round(($_.GetAllStorages().Stats.DataSize | Measure-Object -Sum).Sum/1GB,1)}}, @{N="JobID";E={$_.JobId}},@{N="VmCount";E={$_.VmCount}}|Export-csv -Path $ScriptPath\working\"JOBTOT"$Epoch.csv -NoTypeInformation
Get-VBRBackupSession -Name * | Get-VBRTaskSession | Select @{N="#Date";E={$_.Info.QueuedTime}}, @{N="Id";E={$_.Id}},@{N="Name";E={$_.Name}}, @{N="JobName";E={$_.JobName}}, @{N="JobSessId";E={$_.JobSessId}}, @{N="Status";E={$_.Status}}, @{N="Reason";E={$_.Info.Reason}} | Export-csv -Path $ScriptPath\working\"JOBTSK"$Epoch.csv -NoTypeInformation
disconnect-vbrserver
Depending on your wishes on how much data should be ingested, you can now edit the time of the scheduled task to suit your needs.
Now that we have set up every component in order to monitor the Veeam data with Splunk, we can have a final closer look on how the data collection works.
How data collection works
The data collection itself takes place through the PowerShell script. The script itself utilizes the Veeam PowerShell Snap-In to collect information regarding Proxy Servers, Backup Repositories, the VBR server itself, Backup Jobs, Backup sessions and so on.
For each collected entity the PowerShell script creates a .csv file which gets imported from Splunk.
If you have another look at the binary folder of the technology plugin, you will notice a folder called “working”. This is the folder where all the .csv files are placed after they have been created with the PowerShell script.
If you move one folder up and navigate to the “default” folder you will notice two .conf files. The important file here is the “inputs.conf”. This file steers which data gets pushed to the Splunk server and how they get pushed. Let’s have a look at the file.
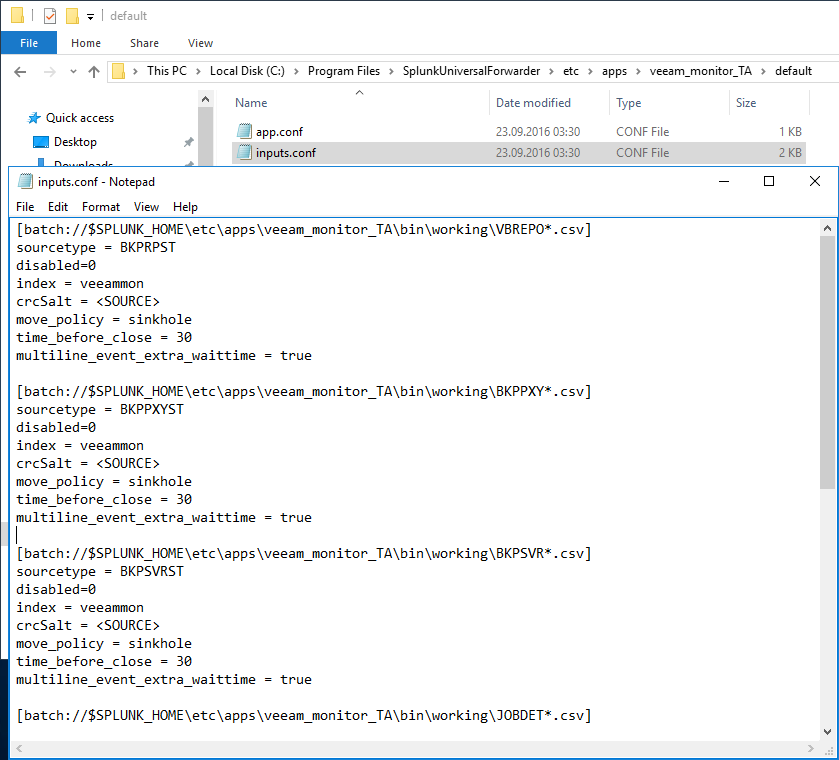
You are able to see, that there is a separate stanza for each .csv file created by the PowerShell script. The “batch://xxxx” prefix means, that the .csv file placed in the “working” folder gets pushed to the Splunk server and then deleted in the “working” folder. If you don’t want to lose the created .csv files from the PowerShell script you could exchange “batch” with “monitor”. The “monitor” prefix would also push the .csv files to the Splunk server but wouldn’t delete these .csv files in the “working” folder.
You could also disable or enable which entities will be pushed to the Splunk server or modify and extend the inputs.conf.
This is it !
Due to our scheduled task the .csv files are generated depending on the settings of the task and get pushed to the Splunk server. In this way our Splunk server gets filled with Veeam data from time to time.
Review in the webinterface
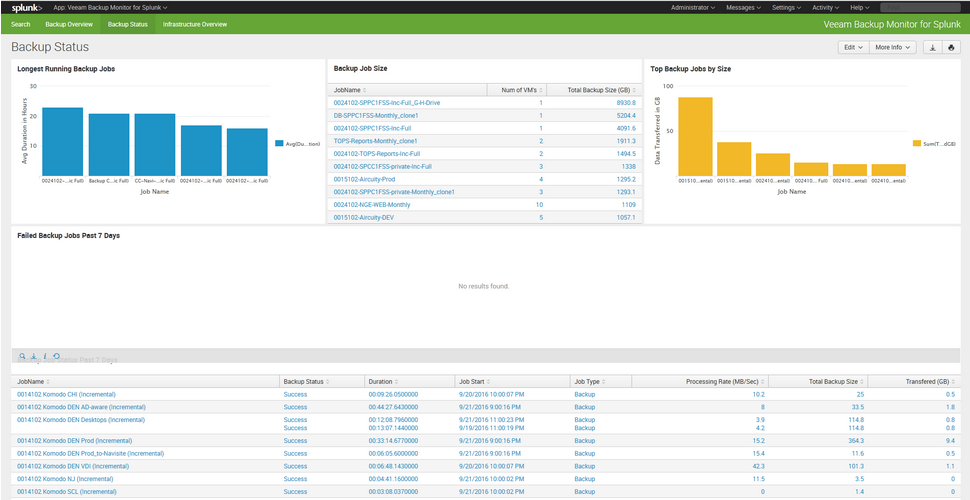
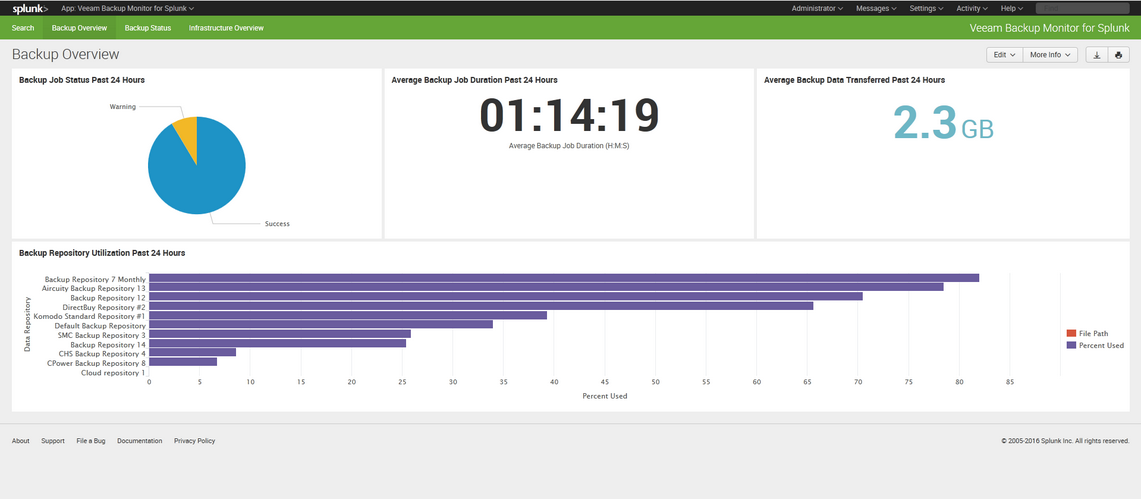
Now we are able to explore our fresh data coming from the Veeam Backup & Replication server in the Splunk webinterface. As i did not run the PowerShill script very often or for several days, you won’t see that much data. Here is the first approach on exploring the data in the Splunk web interface.
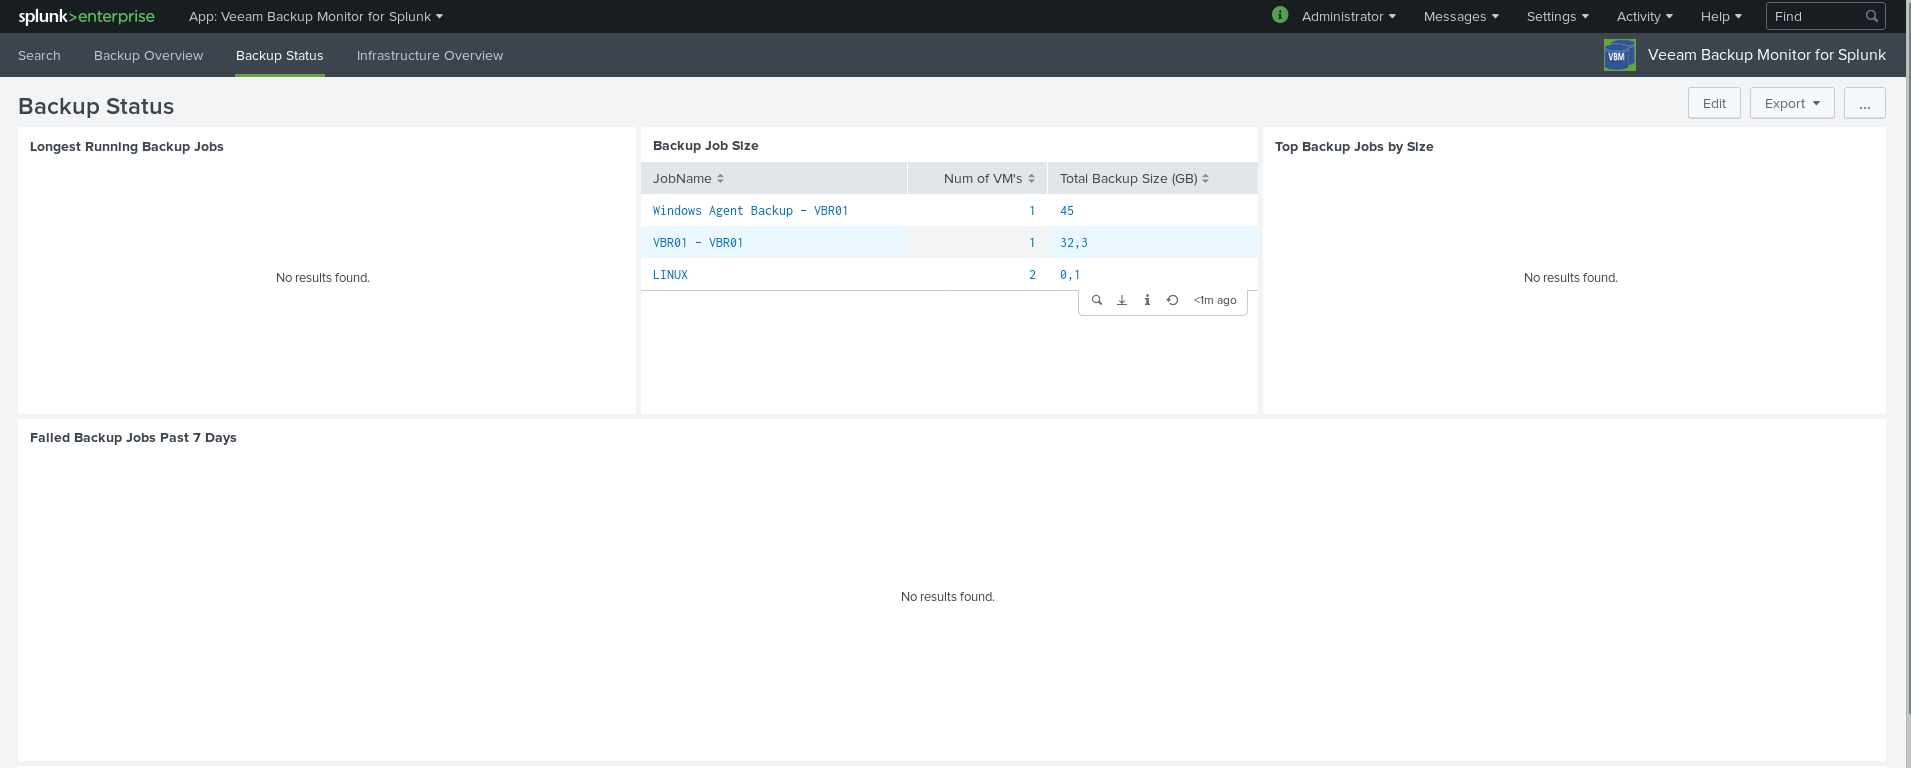
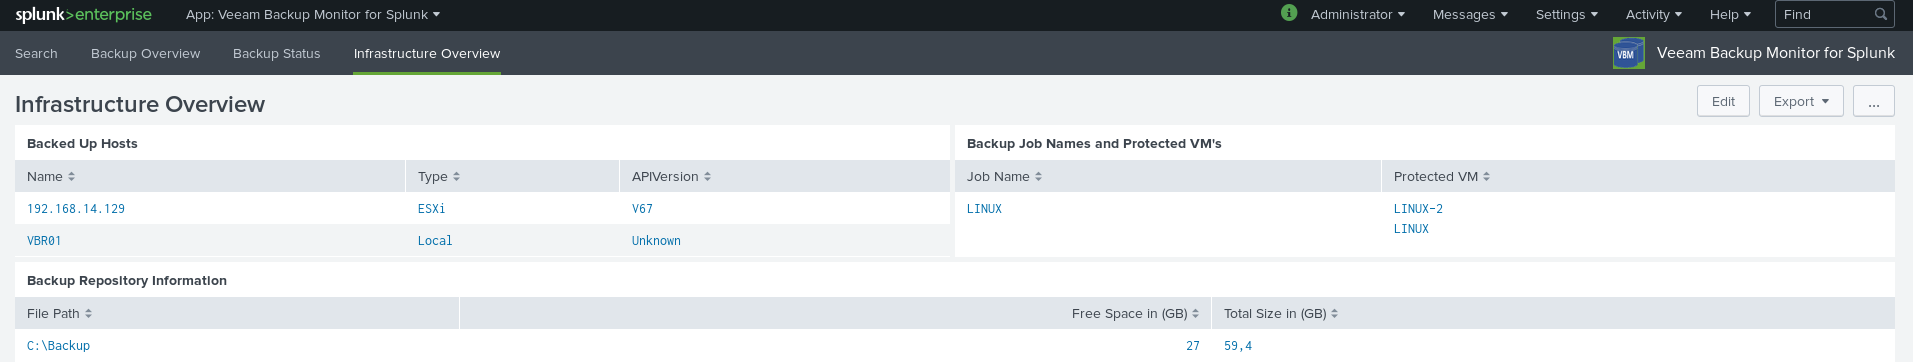
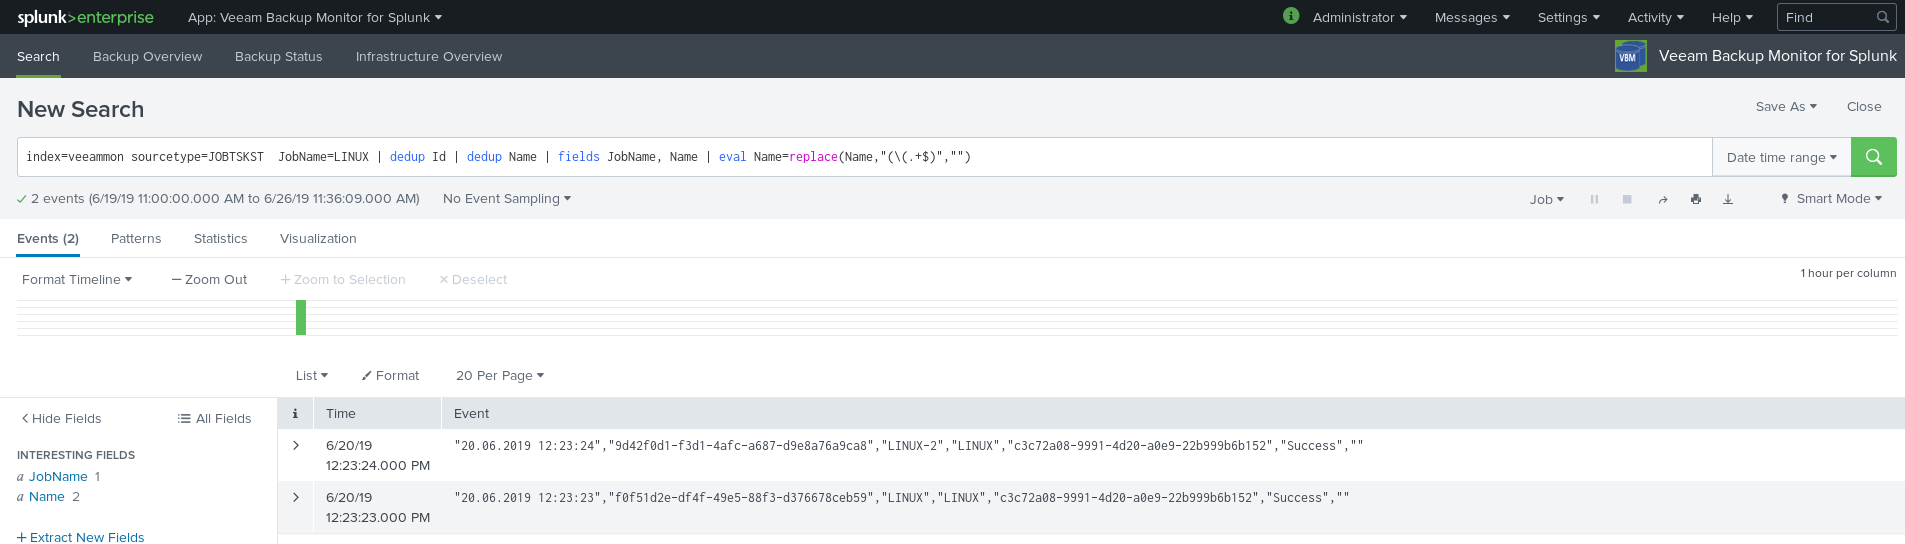
When you have more data, you will see something similar to the screenshots provided by the author of the plugin: https://splunkbase.splunk.com/app/3328/
Summary
In this part of the series, I covered several steps for getting our Veeam data into Splunk. It began with the configuration of the receiver and the universal forwarder and ended with the installation and configuration of the technology addon. Within this series i wanted to share my hands-on experience on Splunk in combination with Veeam and it worked very well. I hope this tutorial gives you the ability to set up a Splunk server with the Veeam integration for yourself.
Thanks for reading !
Monitoring Veeam with Splunk series
Go to Part 1: Monitoring Veeam Backup & Replication with Splunk – Part 1 Installation
Go to Part 2: Monitoring Veeam Backup & Replication with Splunk – Part 2 Installing the Plugin and configuring the Firewall
Go to Part 3:Monitoring Veeam Backup & Replication with Splunk – Part 3 Getting Veeam Data into Splunk

Great write up, thank you! This helped a lot… I’m still incredibly surprised that so many backup solutions fail to implement a syslog sender.
Hi,
I read your blog. its very helpful for us. Its very easy to understand and you mentioned every step in this blog. I am very impressed with blog. Thanks for writting this blog. I want to give you 10 start out of 10.
Is there an update to this app?
unfortunately not..